Increased observability with the TIG stack
August 10, 2020Observability has become a buzzword lately. I must admit, this is one of the many reasons why I use it in the title. In reality, this article will talk about fetching measurements and creating beautiful graphs to feel like detective Derrick, an old and wise detective solving cases by encouraging criminals to confess by themselves.
With the recent Go programming language gain of popularity, we have seen a lot of new software coming into the database world: CockroachDB, TiDB, Vitess, etc. Among them, the TIG stack (Telegraf, InfluxDB and Grafana) has become a reference to gather and display metrics.
The goal is to see the evolution of different resources usage (memory, processor, storage space), power consumption, environment variables (temperature, humidity), on every single host of the infrastructure.
Telegraf
The first component of the stack is Telegraf, an agent that can fetch metrics from multiple sources (input) and write them to multiple destinations (output). There are tens of built-in plugins available! You can even gather a custom source of data with exec with an expected format.
I configured Telegraf to fetch and send metrics every minute (interval and flush_interval in the agent section is “60s”) which is enough for my personal usage. Most of the plugins I use are built-in: cpu, disk, diskio, kernel, mem, processes, system, zfs, net, smart, ping, etc.
The zfs plugin fetches ZFS pool statistics like size, allocation, free space, etc, on FreeBSD but not on Linux. The issue is known but has not been merged upstream yet. So I have developed a simple Python snippet to fill the gap on my only storage server running on Linux:
#!/usr/bin/python

import subprocess

def parse_int(s):
    return str(int(s)) + 'i'

def parse_float_with_x(s):
    return float(s.replace('x', ''))

def parse_pct_int(s):
    return parse_int(s.replace('%', ''))

if __name__ == '__main__':
    measurement = 'zfs_pool'

    pools = subprocess.check_output(['/usr/sbin/zpool', 'list', '-Hp']).splitlines()
    output = []
    for pool in pools:
        col = pool.split("\t")
        tags = {'pool': col[0], 'health': col[9]}
        fields = {}

        if tags['health'] == 'UNAVAIL':
            fields['size'] = 0
        else:
            fields['size'] = parse_int(col[1])
            fields['allocated'] = parse_int(col[2])
            fields['free'] = parse_int(col[3])
            fields['fragmentation'] = '0i' if col[6] == '-' else parse_pct_int(col[6])
            fields['capacity'] = parse_int(col[7])
            fields['dedupratio'] = parse_float_with_x(col[8])

        tags = ','.join(['{}={}'.format(k, v) for k, v in tags.items()])
        fields = ','.join(['{}={}'.format(k, v) for k, v in fields.items()])
        print('{},{} {}'.format(measurement, tags, fields))
Called by the following input:
[[inputs.exec]]
  commands = ['/opt/telegraf-plugins/zfs.py']
  data_format = "influx"
This exec plugin does exactly the same job as the zfs input running on FreeBSD.
All those metrics are sent to a single output, InfluxDB, hosted on the monitoring server.
InfluxDB
Measurements can be stored in a time series database which is designed to organize data around time. InfluxDB is a perfect use case for what we need. Of course, there are other time series databases. I’ve chosen this one because it is well documented, it fits my needs and I wanted to learn new things. Installation is straightforward. I’ve enabled HTTPS and authentication. I use a simple setup with only one node in the cluster. No sharding. Only one database. Even if there is not so many metrics sent by Telegraf, I’ve created a default retention policy to store two years of data which is more than enough. A new default retention policy will become the default route to store all your new points. Don’t be afraid to see all the existing measurements vanished. Nothing has been deleted. They just are under the previous policy and need to be moved. You should define a backup policy too.
Grafana
Now that we are able to gather and store metrics, we need to visualize them. This is the role of Grafana. During my career, I played with Graylog, Kibana and Grafana. The last one is my favorite. It is generally blazing fast! Even on a Raspberry Pi. The look and feel is amazing. The theme is dark by default but I like the light one.
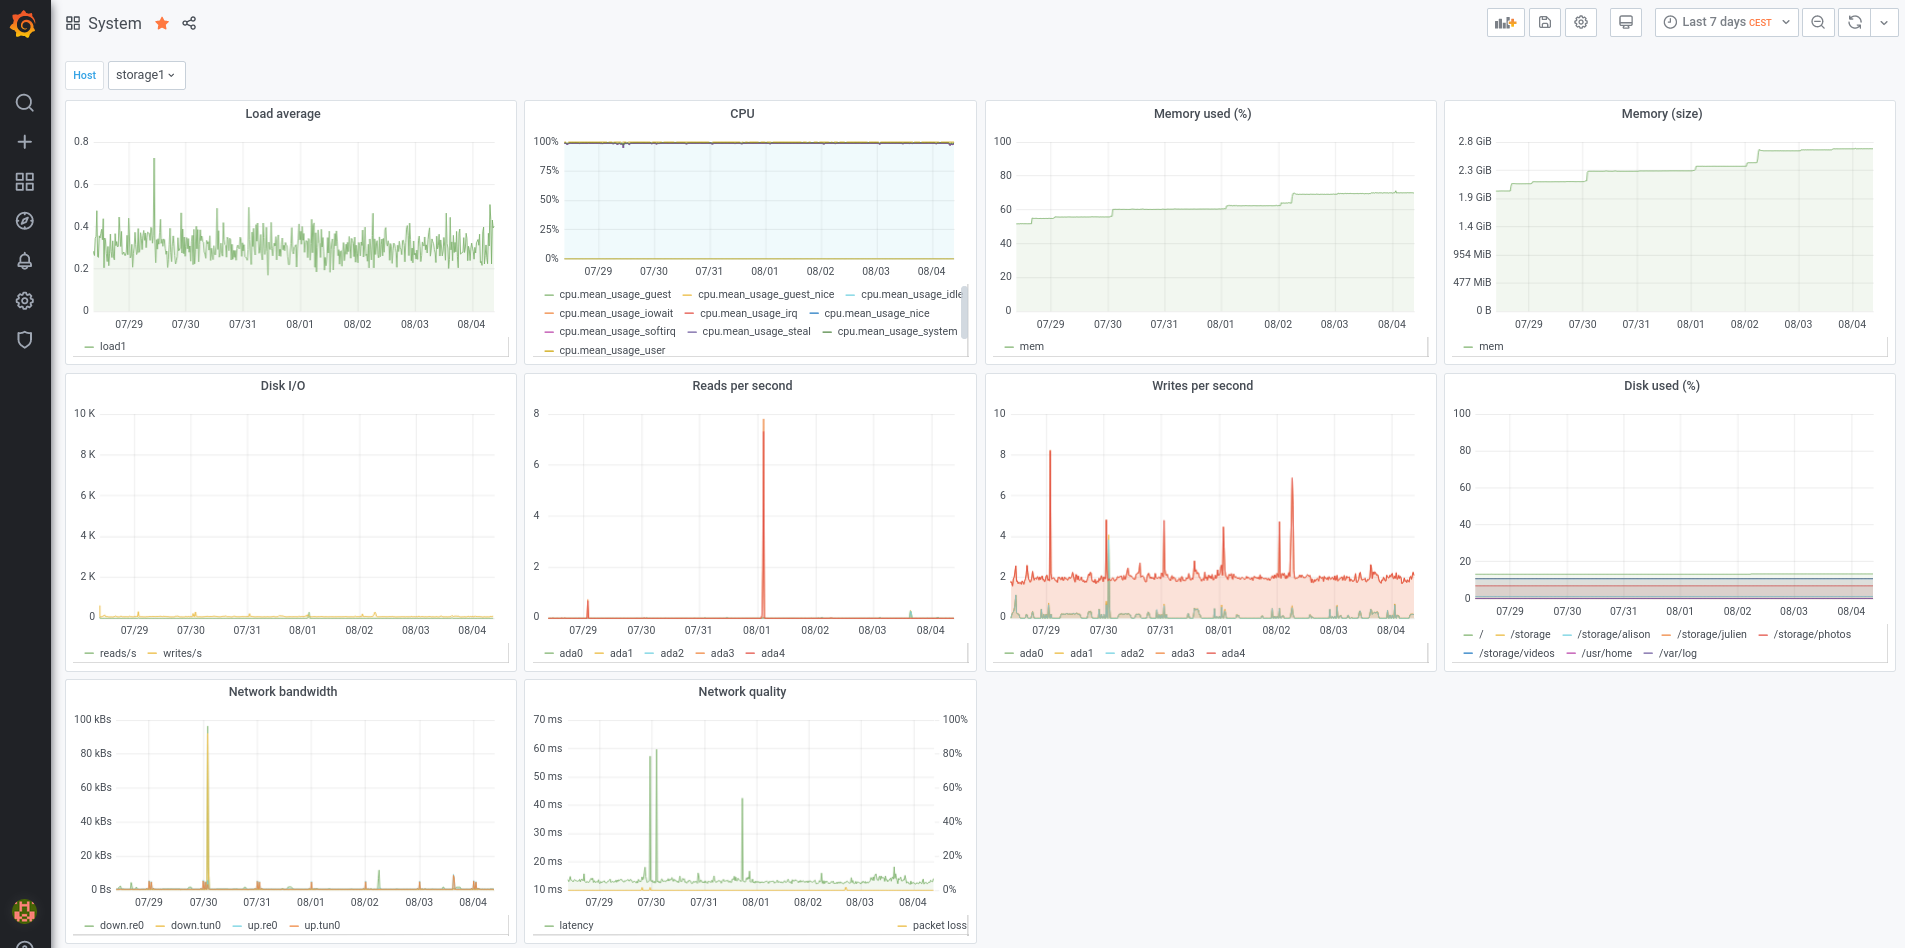
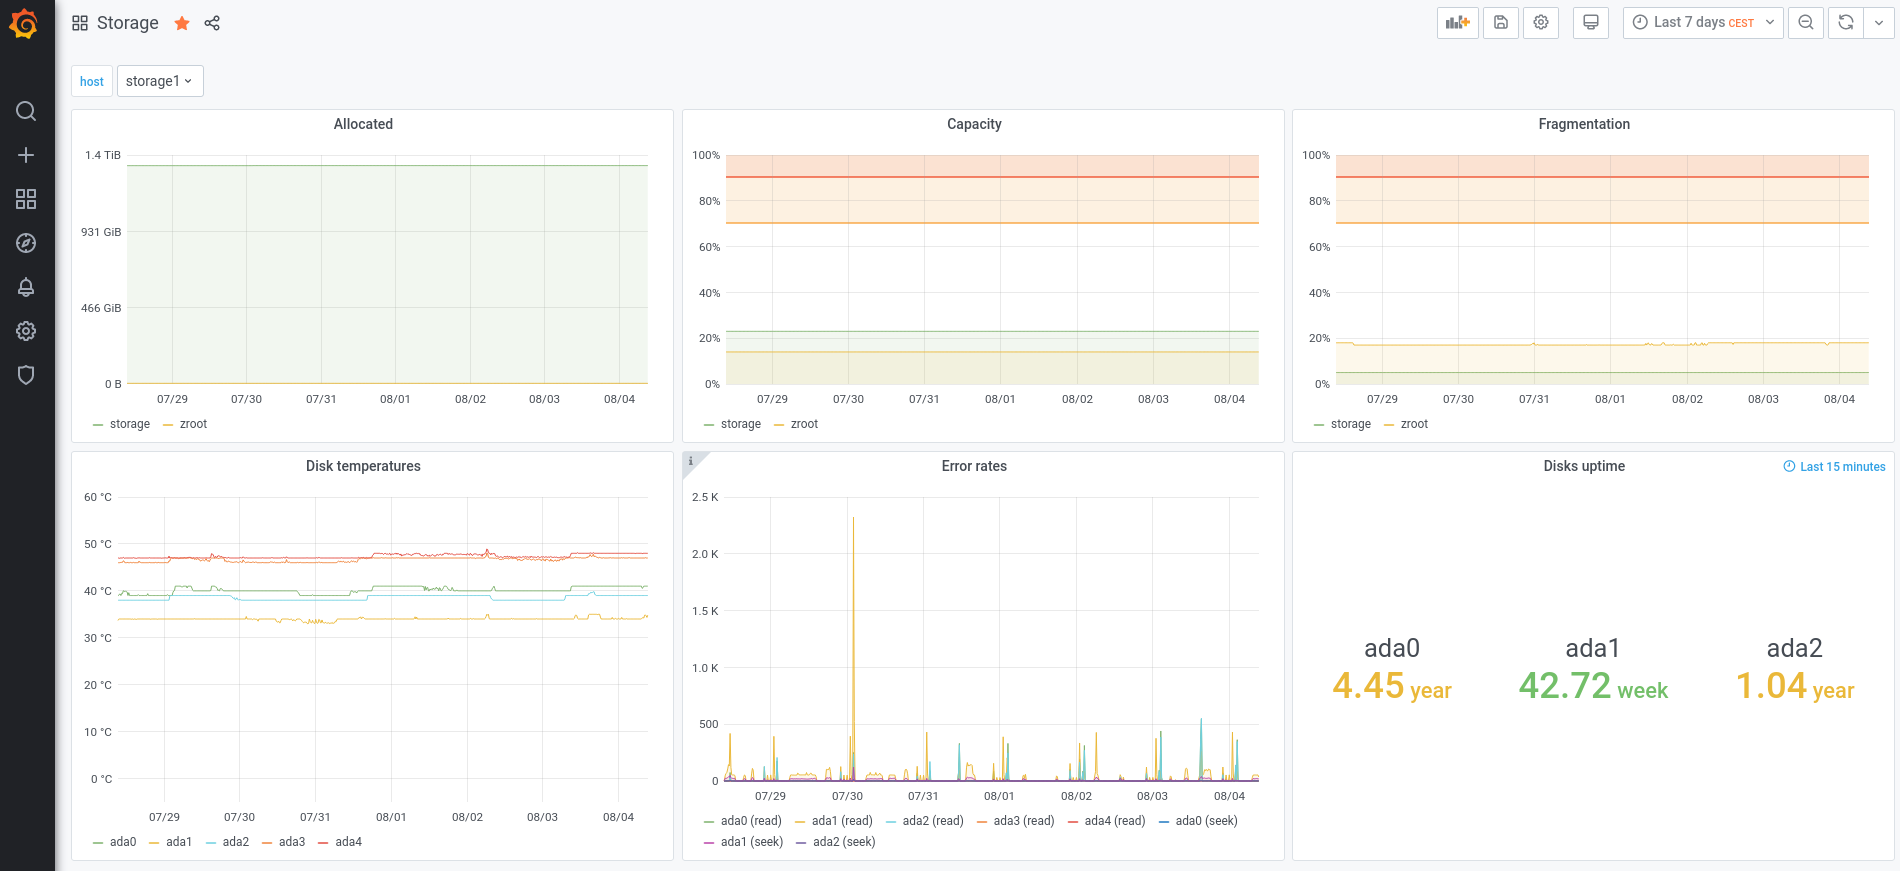
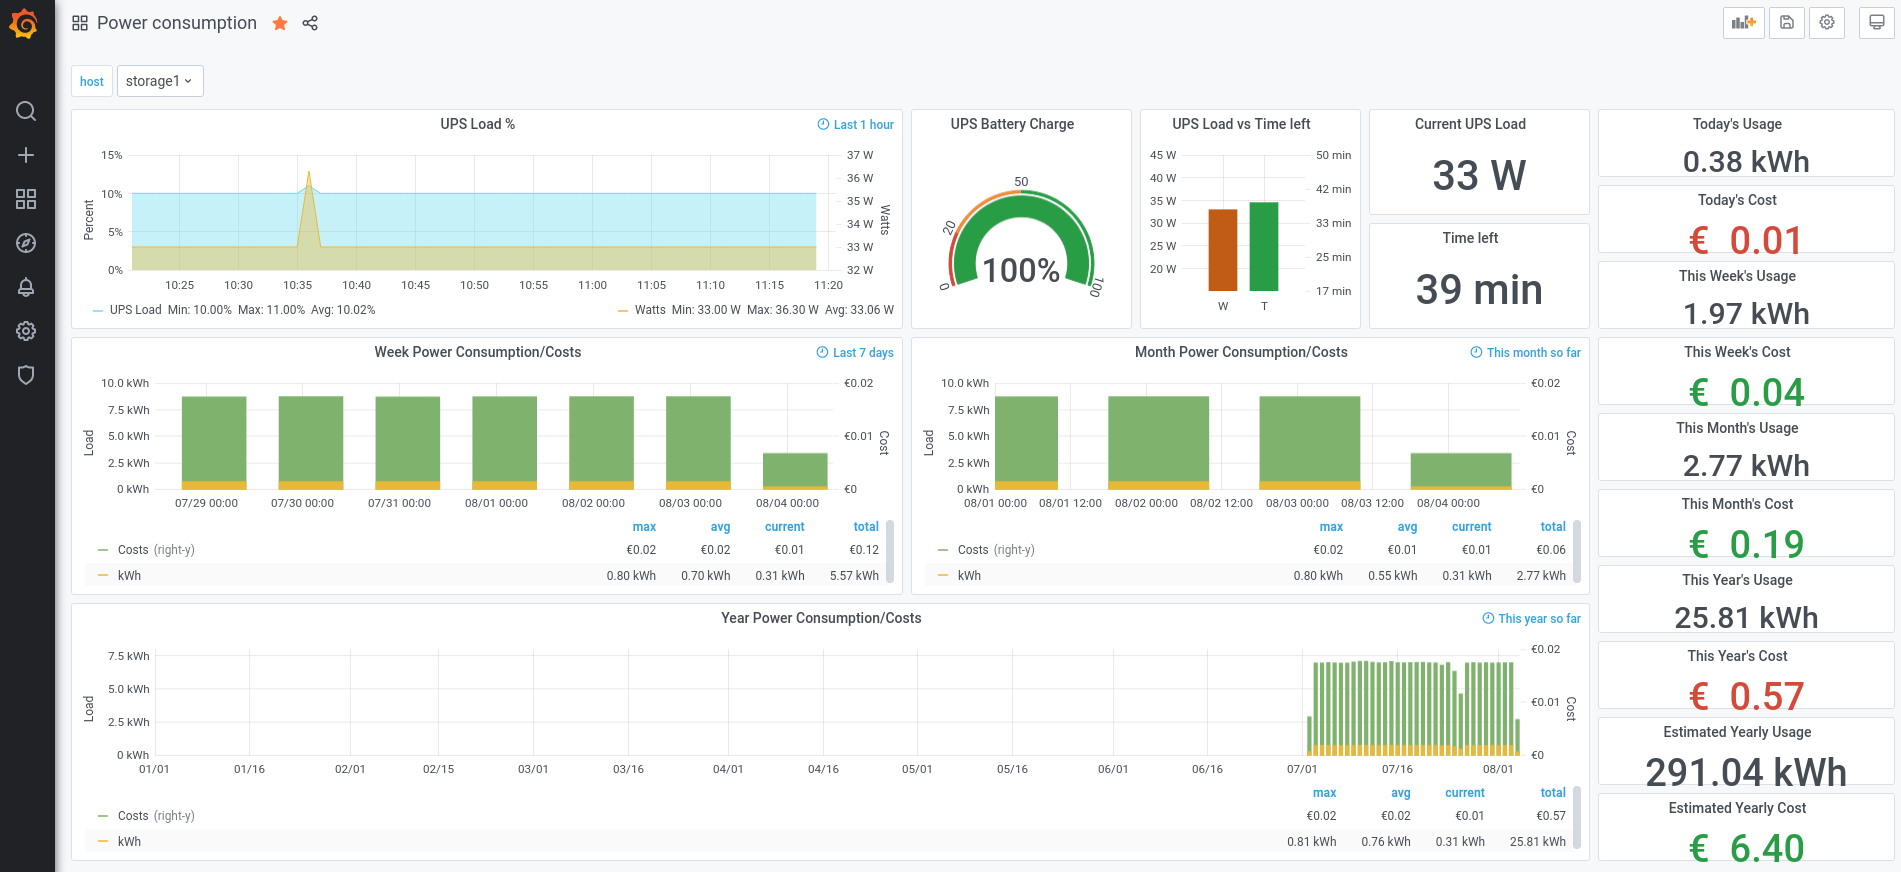
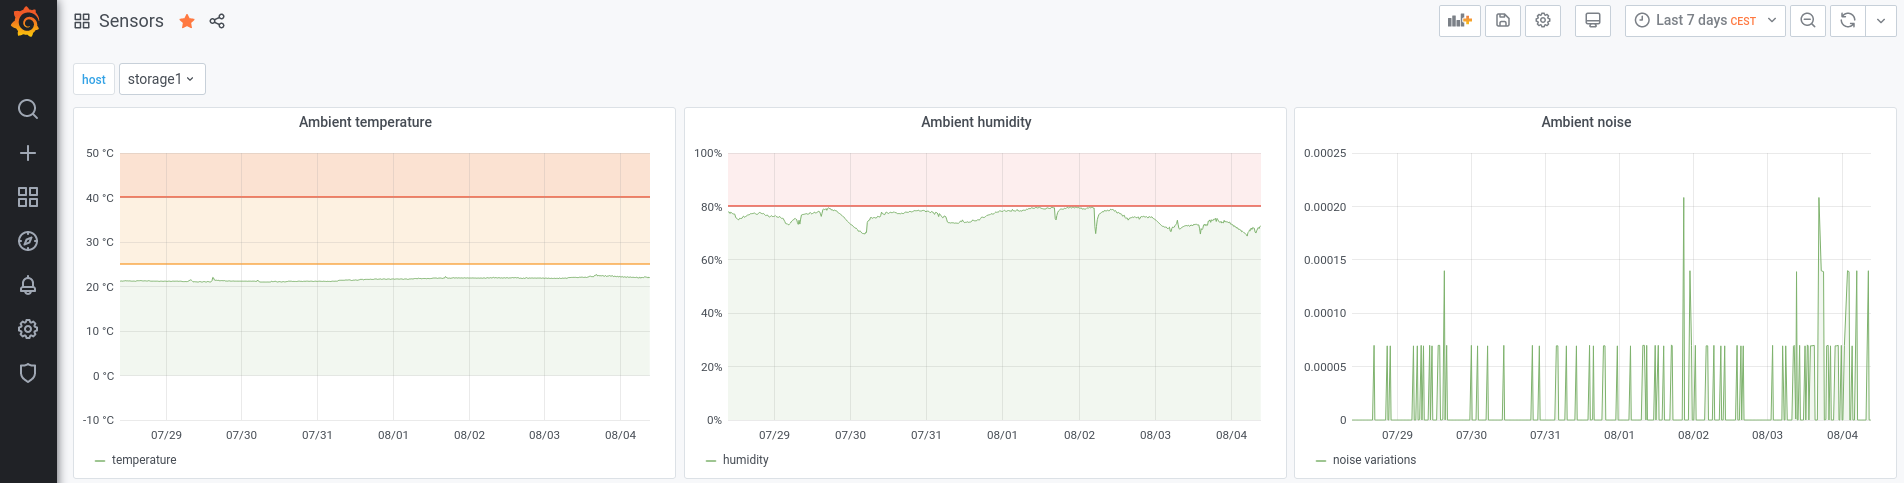
I have created four dashboards:
- system: load, processor, memory, system disk usage, disk i/o, network quality and bandwidth
- storage: ZFS pool allocation, capacity, fragmentation and uptime for each disk
- power consumption: kWh used per day, week, month, year, current UPS load, price per year (more details on a next post)
- sensors: ambient temperature, humidity and noise (more details on a next post)
Every single graph has a $host variable at the dashboard level to be able to filter metrics per host. On top of the screen, a dropdown menu is automatically created to select the host based on an InfluxDB query.
And because a picture is worth a thousand words, here are some screenshots of my own graphs:
Infrastructure
To sum this up, the infrastructure looks like this:

Whenever I want, I can sit back on a comfortable sofa, open a web browser and let the infrastructure speak for itself. Easy, right?