Problem detection and alerting
August 7, 2020Everything is distributed, automated and runs in perfect harmony with a common goal: protect your data. But bad things happen, and rarely when you expect them. This is why you need to watch for services states and send a notification when something goes wrong. Monitoring systems are well-known in the enterprise world. For our use case, we don’t need to deploy a complex infrastructure to check couple of hosts. For this reason, I choose to use the good old Nagios Core. It even provides a web interface for humans like us.
How it works
There are two types of checks:
- host: check if host is alive or not
- service: check if service of a host is healthy or not
To check if a host is available, the simplest implementation is to use ping:

For services, there is a tool to execute remote plugins called NRPE1. It works with a client on the monitoring host and an agent on the remote host that executes commands on demand. The return code defines the check result.

Services states can be:
- OK: it works as expected
- WARNING: it works but we should take a look
- CRITICAL: it’s broken
- UNKNOWN: something is wrong with the plugin configuration or communication
Plugins can define a warning and/or critical threshold to manage the expected state. For example, I would like to know when disk space usage of a storage host goes over, say, 80% (warning) and 100% (critical). I have time to take action to free some space or order new hard drives before it becomes critical. And if I do nothing, a higher alert will be sent if the disk becomes full.
Installation
My monitoring host runs on Raspbian 10:
apt update
apt install nagios4 monitoring-plugins
Installed.
By default, the web interface was broken. I had to disable the following block in the /etc/nagios4/apache2.conf file:
#   <Files "cmd.cgi">
#       ...
#    </Files>
For security reasons, I enabled a basic authentication (a.k.a htaccess) in the DirectoryMatch block of the same file and created an admin user:
AuthUserFile "/etc/nagios4/htdigest.users"
AuthType Basic
AuthName "Restricted Files"
AuthBasicProvider file
Require user admin
In the CGI configuration file /etc/nagios4/cgi.cfg, the default user can be set to admin as it is now protected by basic security:
default_user_name=admin
Now the web interface should be up and running at http://monitoring-ip/nagios4. For my own usage, I’ve set up a reverse proxy (nginx) on the VPS host to expose this interface to a public endpoint so I can access it from anywhere with my credentials.
Configuration
A fresh installation applies sane defaults to make Nagios work out-of-the-box. It even enables localhost monitoring. Unfortunately, I want to check this host like any other server in the infrastructure. The first thing I do is to disable the following include in /etc/nagios4/nagios.cfg file:
#cfg_file=/etc/nagios4/objects/localhost.cfg
I don’t want to be spammed by my monitoring system. Servers may be slower and take time to respond. The Wi-Fi connection of the monitoring system may hang for a while… until someone reboots the host physically. During this extended period of time (multiple hours), my family and I may sleep. I don’t want to wake up with hundreds of notifications saying “Hey, the monitoring system is DOWN!”. One or two notifications is enough.
The following new templates can be defined in /etc/nagios4/conf.d/templates.cfg:
define host {
    name                    home-host
    use                     generic-host
    check_command           check-host-alive
    contact_groups          admins
    notification_options    d,u,r
    check_interval          5
    retry_interval          5               ; retry every 5 minutes
    max_check_attempts      12              ; alert at 1 hour (12x5 minutes)
    notification_interval   720             ; resend notifications every 12 hours
    register                0               ; template
}

define service {
    name                    home-service
    use                     generic-service
    check_interval          5
    retry_interval          5               ; retry every 5 minutes
    max_check_attempts      12              ; alert at 1 hour (12x5 minutes)
    notification_interval   720             ; 12 hours
    register                0               ; template
}
There are multiple components to define:
- hosts (/etc/nagios4/conf.d/hosts.cfg): every single host
- hostgroups (/etc/nagios4/conf.d/hostgroups.cfg): groups of hosts
- services (/etc/nagios4/conf.d/services.cfg): services that will be attached to hostgroups
For example, I need to know ZFS usage of all storage servers:
- hosts: storage1, storage2, storage3 with their IP addresses
- hostgroups: storage-servers that will regroup storage1, storage2 and storage3
- services: zfs_capacity that will be attached to storage-servers
Host definition:
define host {
    use         home-host
    host_name   storage1
    alias       storage1
    address     XX.XX.XX.XX
}
Hostgroup definition:
define hostgroup {
    hostgroup_name  storage-servers
    alias           Storage servers
    members         storage1,storage2,storage3
}
Service definition:
define service {
    use                 home-service
    hostgroup_name      storage-servers
    service_description zfs_capacity
    check_command       check_nrpe!check_zfs_capacity
}
On all storage servers, we also need to define a NRPE command:
command[check_zfs_capacity]=/usr/local/bin/sudo /usr/local/sbin/sanoid --monitor-capacity
ZFS usage is now monitored!
I have repeated this process for all services I wanted to check to end up with:
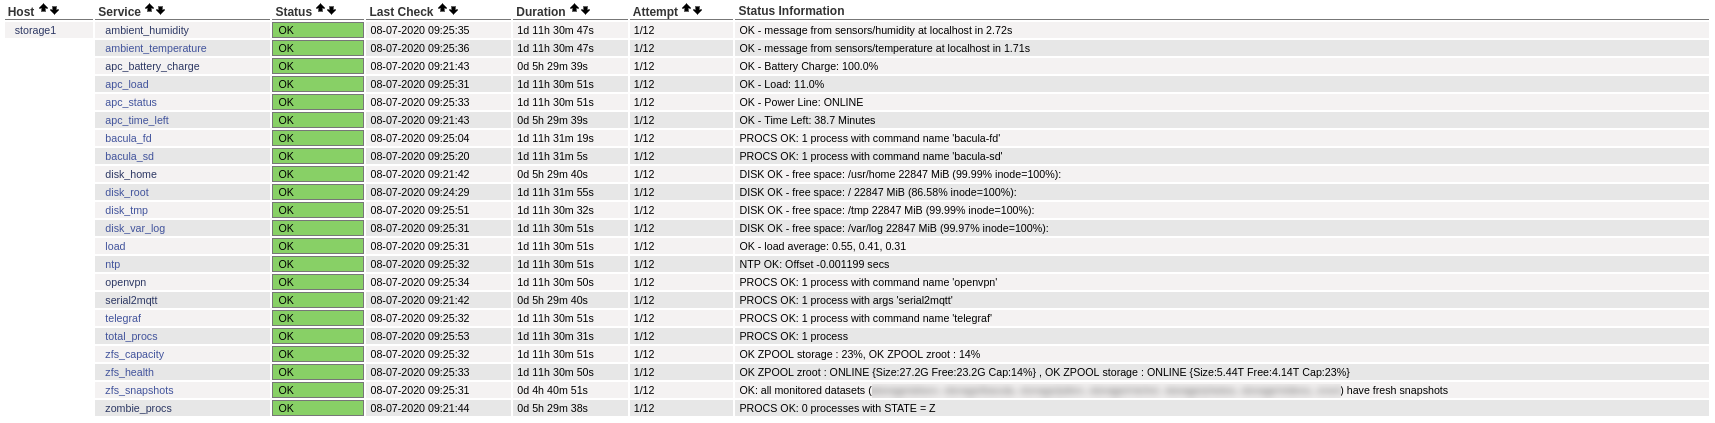
A single host can be in multiple hostgroups. For my tests, I always added features to storage1. I created a hostgroup for each new capability and added only storage1 to it. That means storage1 had the same services as storage2 and storage3, and the new tested ones.
Notifications
At work, we use Opsgenie to define on call schedules within a team. Of course, I don’t want to receive a push notification on my phone for my home servers. This is why I choose to be notified by e-mail. In the past, I hosted some e-mail boxes at home but I didn’t want to deal with spam and SPF records to prove to the world that my service is legit. I have a couple of domain names with (limited) e-mail services included. For the monitoring purpose, this is more than enough to do the job.
On Nagios, you can set the e-mail address in the contacts configuration file /etc/nagios4/objects/contacts.cfg.
I followed this great tutorial to configure postfix to send e-mails using the SMTP server of the provider. Secure and no more spam. I have configured this new e-mail box on my phone so I can be alerted asynchronously and smoothly when something wrong happens.
-
Nagios Remote Plugin Executor ↩︎