Power consumption and failures prevention
August 14, 2020Providing a full storage service means having computers up 24x7. On one hand, if we power off the local storage server when we aren’t using it, we’ll have to find a solution to respect the backup policy and synchronize with remote servers that could be down at the moment. On the other hand, if we let the storage server up all the time, it will consume unnecessary resources and throw money down the drain. I deeply know that a personal computer, which is idle most of the time, doesn’t consume so much power. This is my conviction. But how to verify it?
With observability, I thought it would be easy to gather power consumption via built-in sensors. I tried something that I know, lm_sensors, which is included in the Linux kernel and exposes CPU temperatures, fans speed, power voltages, etc.
storage2 ~ # sensors
k8temp-pci-00c3
Adapter: PCI adapter
Core0 Temp:   +30.0°C
Core0 Temp:   +22.0°C
Core1 Temp:   +30.0°C
Core1 Temp:   +16.0°C

acpitz-acpi-0
Adapter: ACPI interface
temp1:        +40.0°C  (crit = +75.0°C)

atk0110-acpi-0
Adapter: ACPI interface
Vcore Voltage:      +1.10 V  (min =  +1.45 V, max =  +1.75 V)
 +3.3 Voltage:      +3.39 V  (min =  +3.00 V, max =  +3.60 V)
 +5.0 Voltage:      +4.97 V  (min =  +4.50 V, max =  +5.50 V)
+12.0 Voltage:     +12.22 V  (min = +11.20 V, max = +13.20 V)
CPU FAN Speed:     3391 RPM  (min =    0 RPM, max = 1800 RPM)
CHASSIS FAN Speed:    0 RPM  (min =    0 RPM, max = 1800 RPM)
POWER FAN Speed:   1662 RPM  (min =    0 RPM, max = 1800 RPM)
CPU Temperature:    +26.0°C  (high = +90.0°C, crit = +125.0°C)
MB Temperature:     +37.0°C  (high = +70.0°C, crit = +125.0°C)
The ACPI interface returns some voltages measurements. But I doubt they can be used to find the instant consumption in watt (W) and extrapolate the consumption over time in kilowatt-hour (kWh). On laptops, such information can be computed from battery statistics. Unfortunately, all computers of the infrastructure are desktops without batteries.
I needed to buy a product. A lot of websites talk about how to measure power consumption for computers and even for the whole house. The common thing that comes out is the recommendation to use a wattmeter.
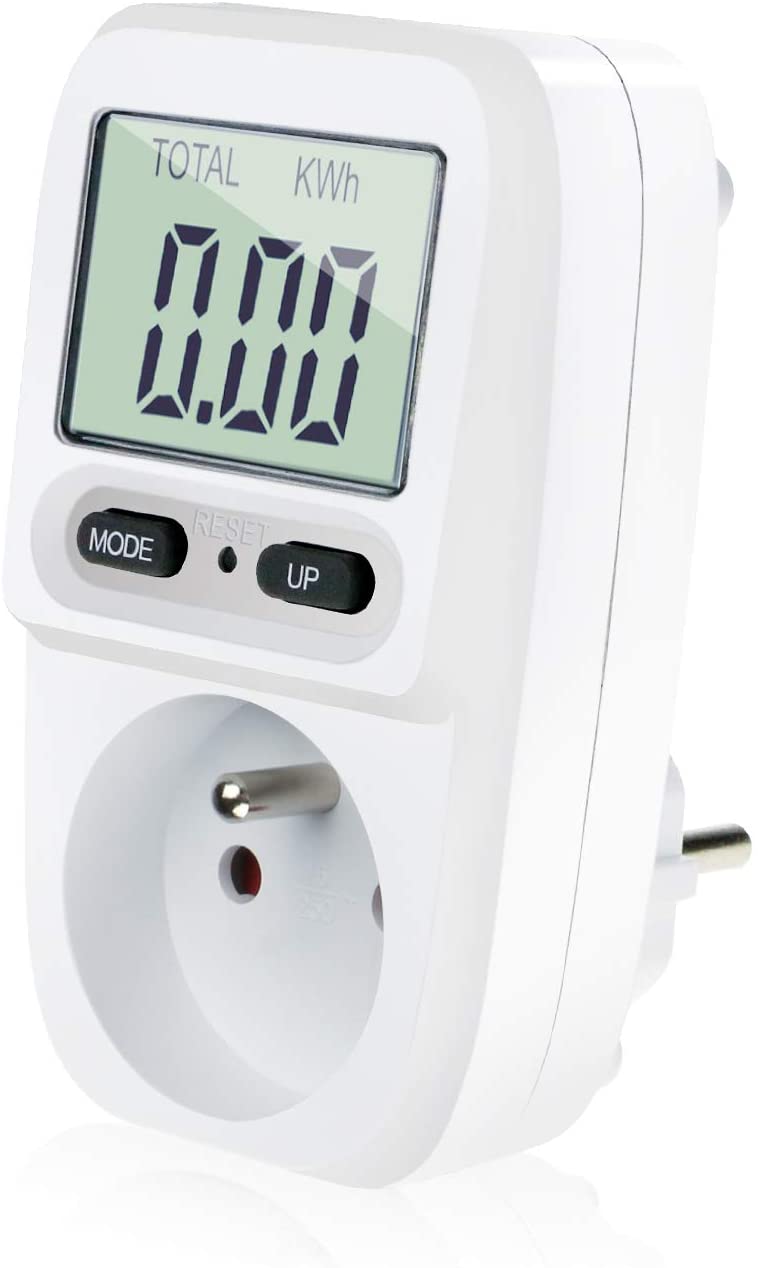
It’s an instrument which can be plugged between the power outlet and your device to measure how much energy is consumed instantaneously (W), over time (kWh) and even the total price if you have configured the kWh price. There is a LCD to display the results. A wattmeter is cheap. I’ve bought this model which does a good job. Sadly, we cannot gather the data from the LCD to load them to the metrics infrastructure easily. It also lacks of precision for the price. We can enter only two digits after the floating point while the energy provider gives us a price with five digits.
Speaking of the price, my energy provider publishes a beautiful but beyond understanding grid of prices. They are dependent on the pack of products, the region and the distributor. They change over time. You can have an electrical counter for the day and for the night. Moreover, price is displayed in cents and not euros! I called them to have a price estimation. Come on, we are in a digitized world. They should, at least, display the current price of the contract somewhere in the customer panel.
During my researches, I found that we could use an uninterruptible power supply (UPS) to gather power consumption metrics. As a bonus, it is able to protect from power variations and interruptions that could harm computers. However, they are quite expensive. Their prices range from 50€ to hundreds of euros. As I’m a total newbie in this domain, I’ve read this detailed guide (FR) to gain some knowledge. So I decided to buy an APC Back-UPS Pro 550.
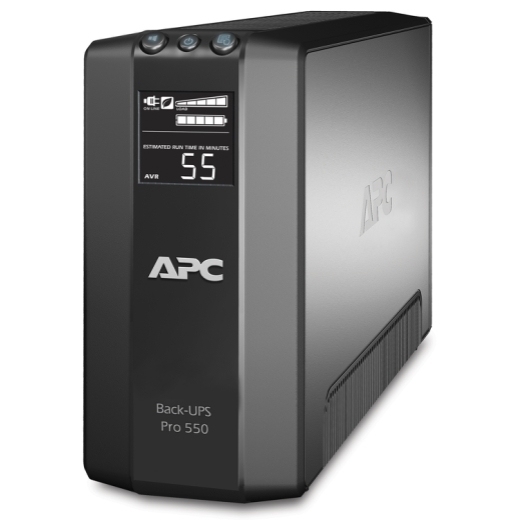
It has an USB interface to control it with apcupsd and display power information with the “apcaccess” binary. It’s compatible with both Debian and FreeBSD and it even has a telegraf plugin!
storage1 ~ # /usr/local/sbin/apcaccess
APC      : 001,036,0867
DATE     : 2020-07-30 15:56:46 +0200
HOSTNAME : storage1
VERSION  : 3.14.14 (31 May 2016) freebsd
UPSNAME  : storage1
CABLE    : USB Cable
DRIVER   : USB UPS Driver
UPSMODE  : Stand Alone
STARTTIME: 2020-07-26 18:28:21 +0200
MODEL    : Back-UPS RS 550G
STATUS   : ONLINE
LINEV    : 234.0 Volts
LOADPCT  : 10.0 Percent
BCHARGE  : 100.0 Percent
TIMELEFT : 37.5 Minutes
MBATTCHG : 5 Percent
MINTIMEL : 3 Minutes
MAXTIME  : 0 Seconds
SENSE    : Medium
LOTRANS  : 176.0 Volts
HITRANS  : 282.0 Volts
ALARMDEL : No alarm
BATTV    : 13.7 Volts
LASTXFER : No transfers since turnon
NUMXFERS : 0
TONBATT  : 0 Seconds
CUMONBATT: 0 Seconds
XOFFBATT : N/A
SELFTEST : NO
STATFLAG : 0x05000008
SERIALNO : 4B1939P01928
BATTDATE : 2019-09-23
NOMINV   : 230 Volts
NOMBATTV : 12.0 Volts
NOMPOWER : 330 Watts
FIRMWARE : 857.L7 .I USB FW:L7
END APC  : 2020-07-30 15:57:32 +0200
The 550 is the first model of the Back-UPS Pro range so it has IEC C13 power plugs only, suitable for computers, but no Euro/French plugs compatible with any electrical device. As I connect only a single computer to the UPS, this is the most economical solution.
Once the data had been fed to the observability platform, I was able to import this beautiful dashboard from the Grafana community. I’ve customized it to my own needs and here is the result:
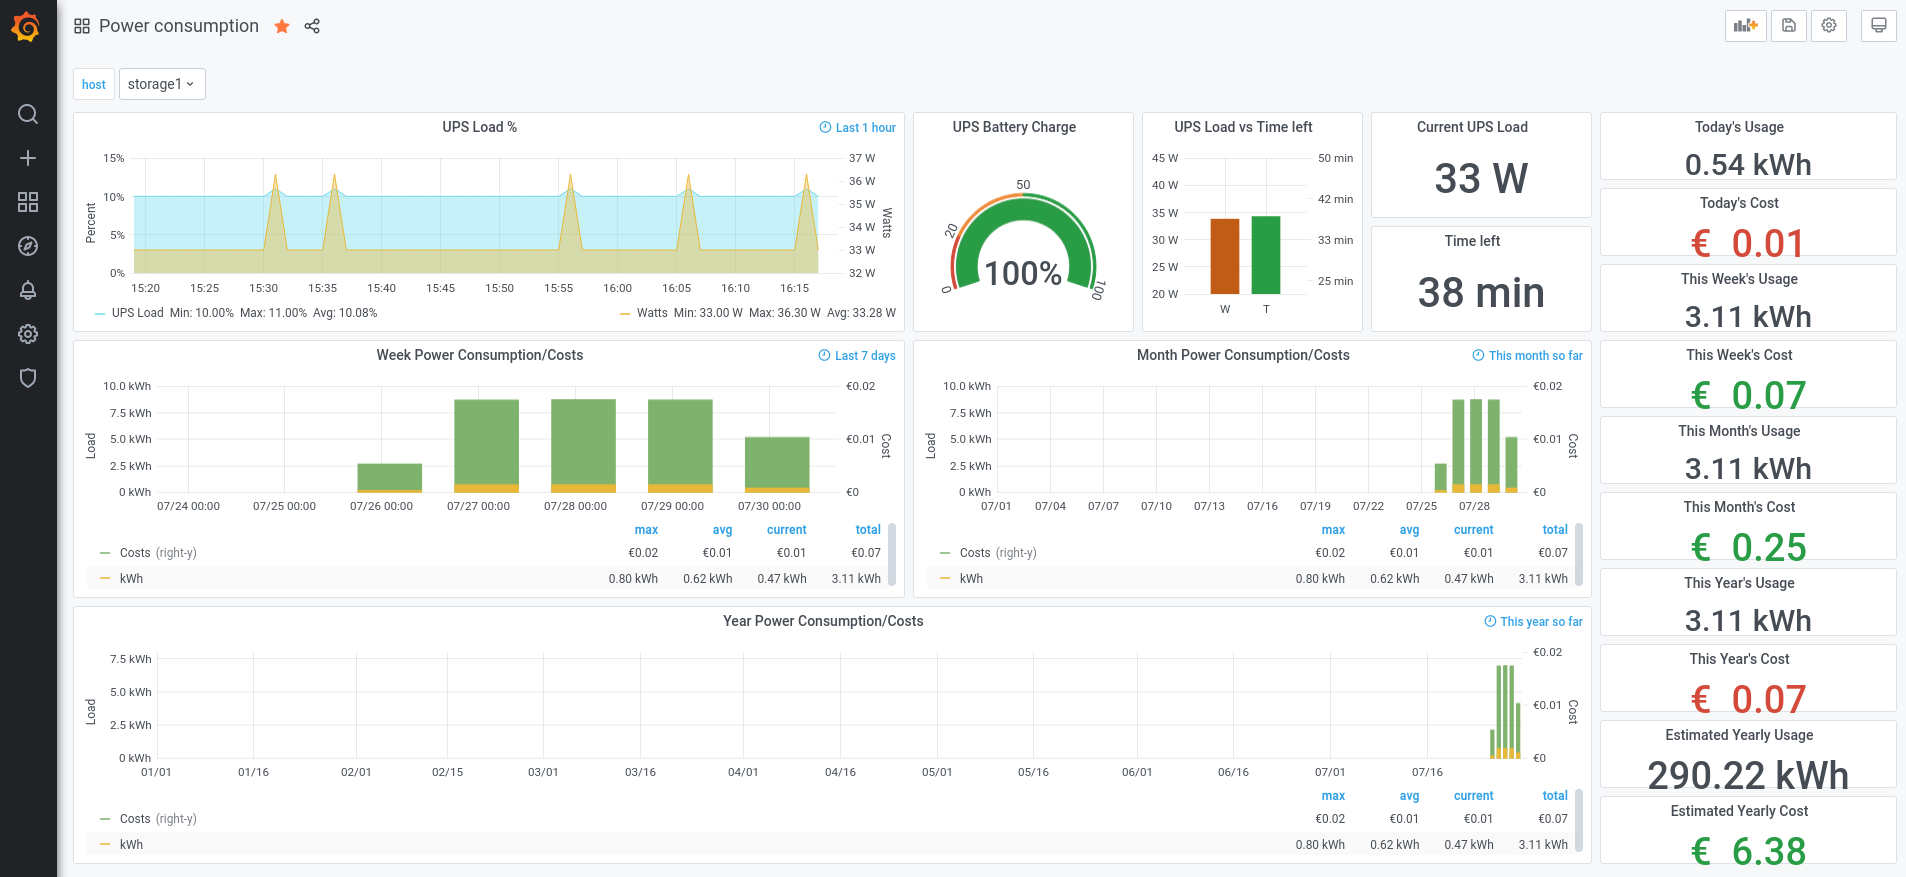
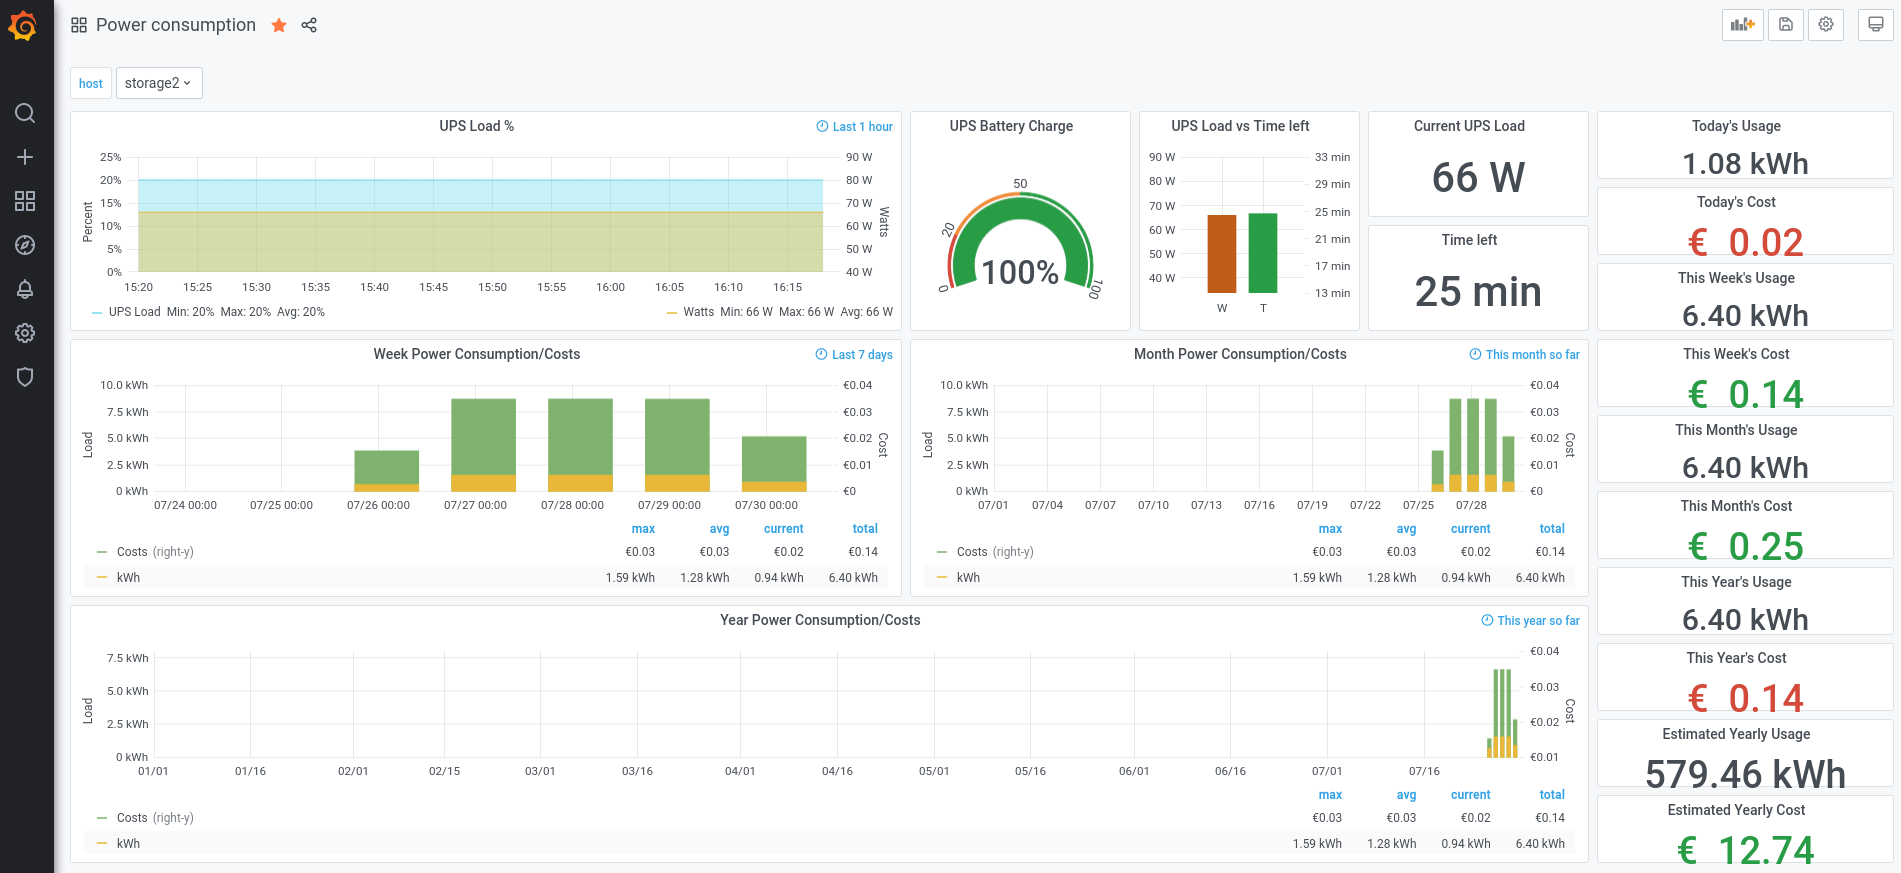
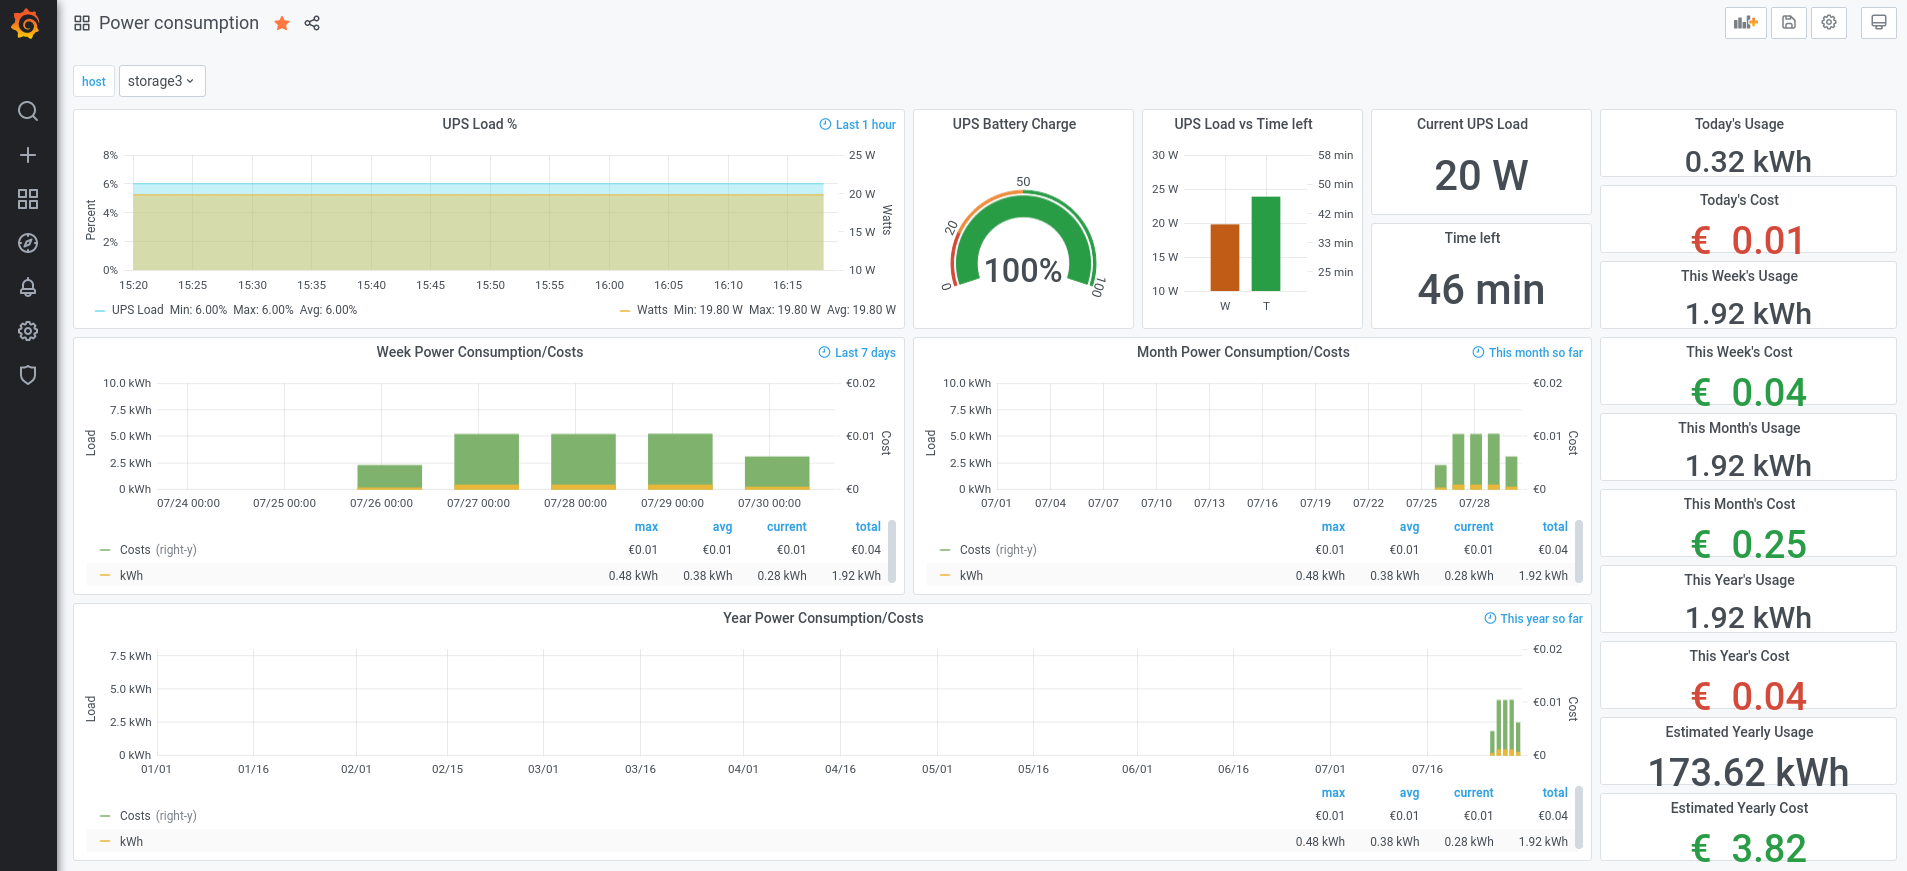
You can download my dashboard here.
Our winner is storage3 which costs less than a kebab per year! The worst case is storage2, the old hardware, that consumes the equivalent of an incandescent light bulb. See, the power consumption is not so bad after all.